Understanding the difference between Power BI reports and dashboards
When working with Power BI, it's important to understand the distinction between reports and dashboards. Whilst both are used to visualise and analyse data, they serve different purposes and offer different capabilities. Here's a quick breakdown of how they compare -
| Feature |
Power BI Reports |
Power BI Dashboards |
| Purpose |
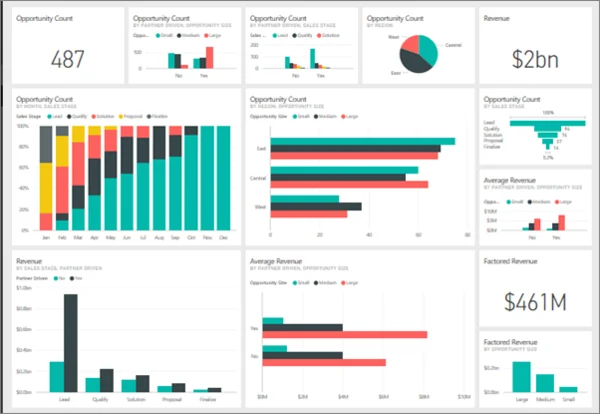
Detailed, interactive collections of visualisations, charts and tables from one or more datasets. Designed for in depth data exploration and analysis. |
High level overview of key metrics, pulling visual data from multiple sources. Ideal for quick decision making. |
| Components |
Made up of pages, each containing one or more visualisations created in Power BI Desktop. |
Consists of tiles (charts, text, images, KPIs) pinned from reports or datasets. |
| Interactivity |
Highly interactive - users can filter, click on data points and drill into details. Supports ad hoc analysis. |
Some interactivity like filtering, but primarily offers a static snapshot of key data. |
| Navigation |
Users can move between multiple report pages to explore different aspects of the data. |
No pages, single screen layout. Clicking a tile takes the user to the underlying report. |
| Customisation |
Layout defined by the report creator, structured to guide users through a data story. |
Users can customise tile layout by arranging and resizing them to suit their needs. |
| Real time data |
Reports refresh when reloaded or manually updated; typically tied to dataset refresh schedule. |
Can be configured for real time data updates, auto refreshing tiles at scheduled intervals. |
| Data sources |
Generally tied to one dataset (or a few related ones) used within the report. |
Can combine visuals from multiple datasets, reports and sources into one unified view. |
| Use cases |
Deep data analysis, detailed performance review and exploration. |
Executive summaries, KPI snapshots and fast decision support. |
Relationship between reports and dashboards
Although Power BI reports and dashboards serve different purposes, they are of course, closely interconnected. Dashboards act as a the de facto gateway to reports, displaying a summary view through pinned visualisations (tiles). Each tile on a dashboard can be linked back to an individual report which allows users to quickly navigate from a high level overview to the granular data that underpins it.
This relationship provides a great user experience in that dashboards deliver instant insights (great for appeasing executives!) and reports provide the means for deep exploration and analysis. Together, they form a complete picture, making it easier to monitor performance at a glance whilst still having the tools to drill down when needed.
When to use a Power BI report
A Power BI report can be used for:
-
In depth exploration of data
-
Detailed performance analysis
-
Custom visuals or calculated measures
-
Multi page navigation
-
Interactive filtering and drilldowns
Reports are a good choice for data analysts, power users and team members who need to study complex datasets in detail.
When to use a Power BI dashboard
A Power BI dashboard can be used for:
-
A single page summary view of data
-
KPIs from multiple sources
-
Real time monitoring of key metrics
-
Executive level visibility
-
A high level snapshot for quick decision making
Dashboards are a good choice for managers and stakeholders who need a quick overview without granular detail.
To finish
Power BI reports and dashboards are complementary tools. Reports give users the ability to interact with data in a deep capacity whilst dashboards provide high level summaries and snapshots of key data. When used together, they can help organisations make better decisions, faster.
If you need help designing your Power BI environment, whether that be for complex reporting or quick, executive ready dashboards, our UK based team can help you identify and subsequently build the right solution.